Mar 26, 2025
SQL | ETL using SSIS | Power BI | DAX | Power Query | Tableau | SSAS | SSRS | SSMS
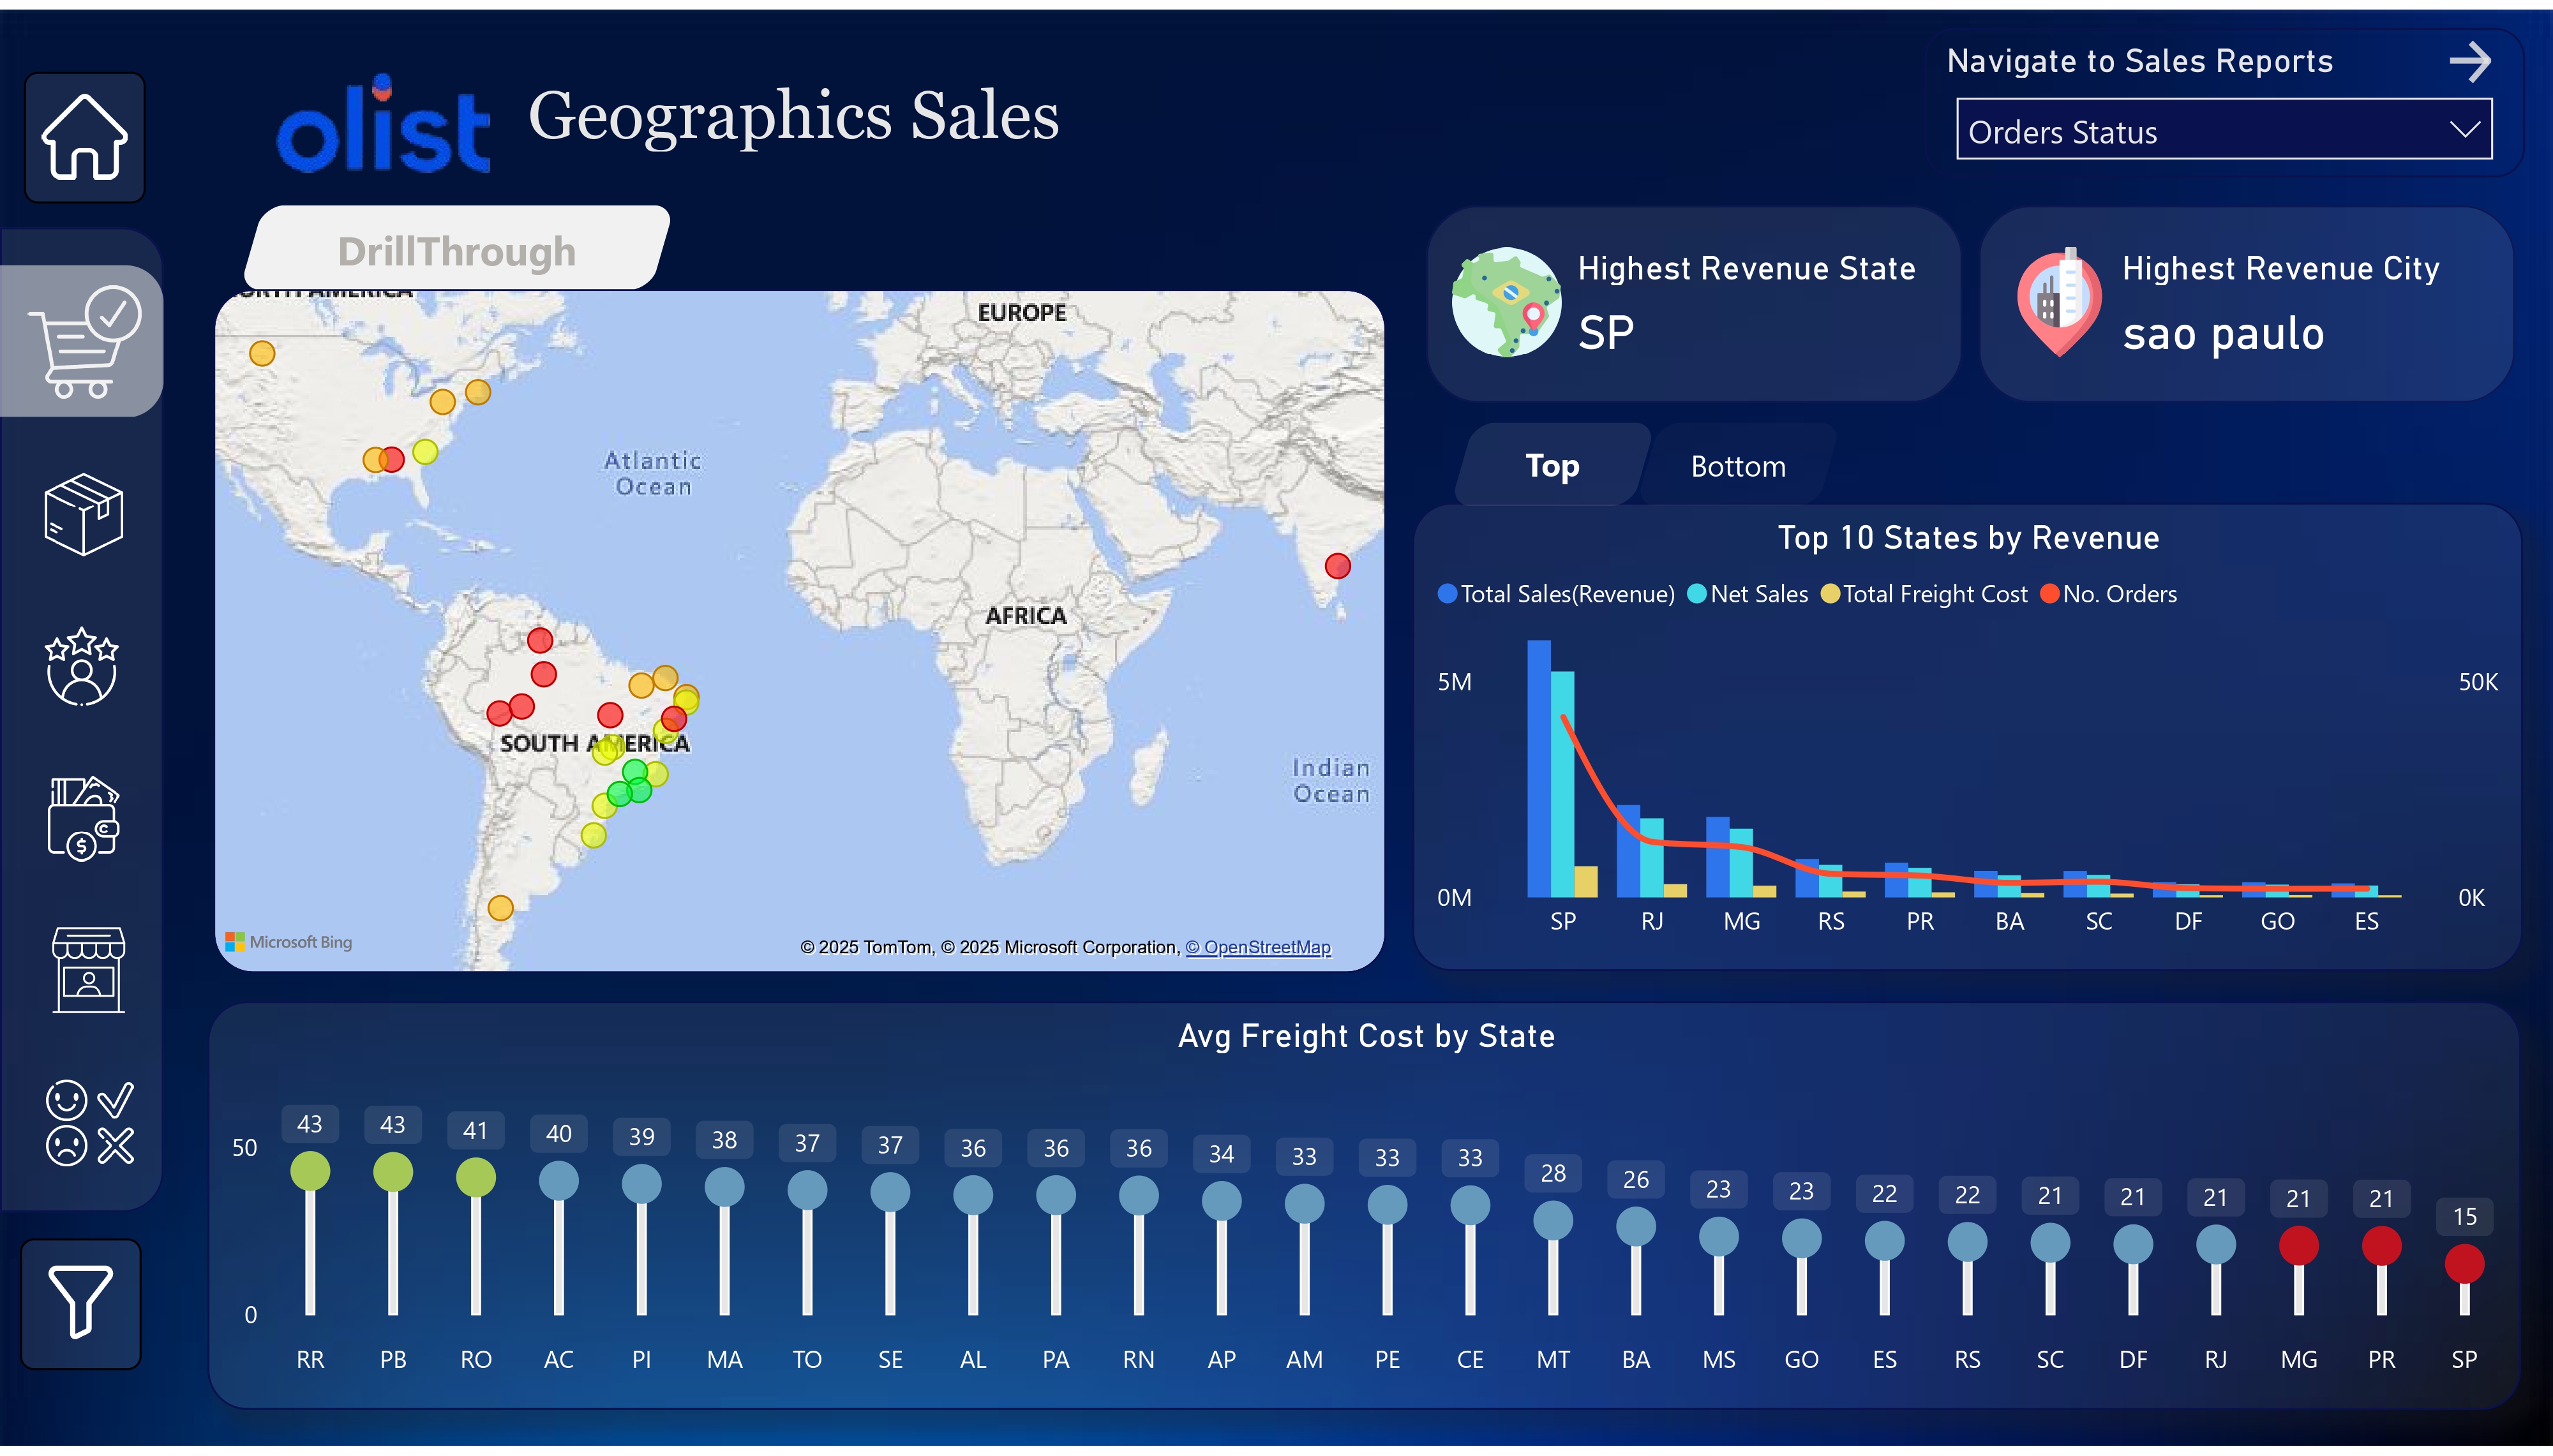
This project provides an end-to-end Business Intelligence (BI) and Data Warehousing solution for Olist,
a Brazilian e-commerce platform. The goal is to transform raw transactional data into meaningful insights
using SQL Server, SSIS, SSAS, SSRS, Power BI, and Tableau. The project covers data extraction, transformation,
loading (ETL), data modeling, dashboard development, and reporting.
 Feb 21, 2025
Tableau | LOD expressions and MDX-like calculations
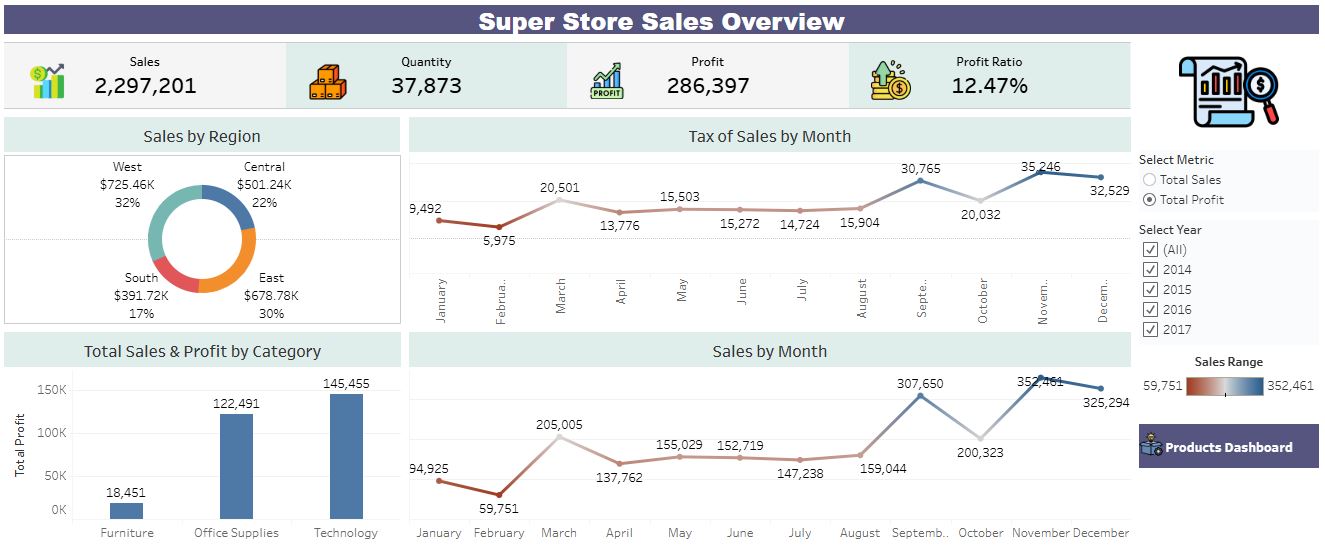
Analyzed Superstore sales data using Tableau, creating dynamic
dashboards and leveraging LOD expressions for advanced data analysis.
Built dynamic Tableau dashboards with advanced visualizations
(heat maps, geographic maps, line and bar charts) for effective data storytelling.
 Feb 11, 2025
Power BI | Power Query | DAX
the project aims to uncover hidden insights,
identify patterns, and understand the factors contributing to airline delays.
The findings will help stakeholders, including airlines, airports, and passengers,
make informed decisions to improve operational efficiency and customer satisfaction.
 Jan 26, 2025
MS SQL Server | ETL | SSIS, SSAS, SSMS | Power BI | DAX
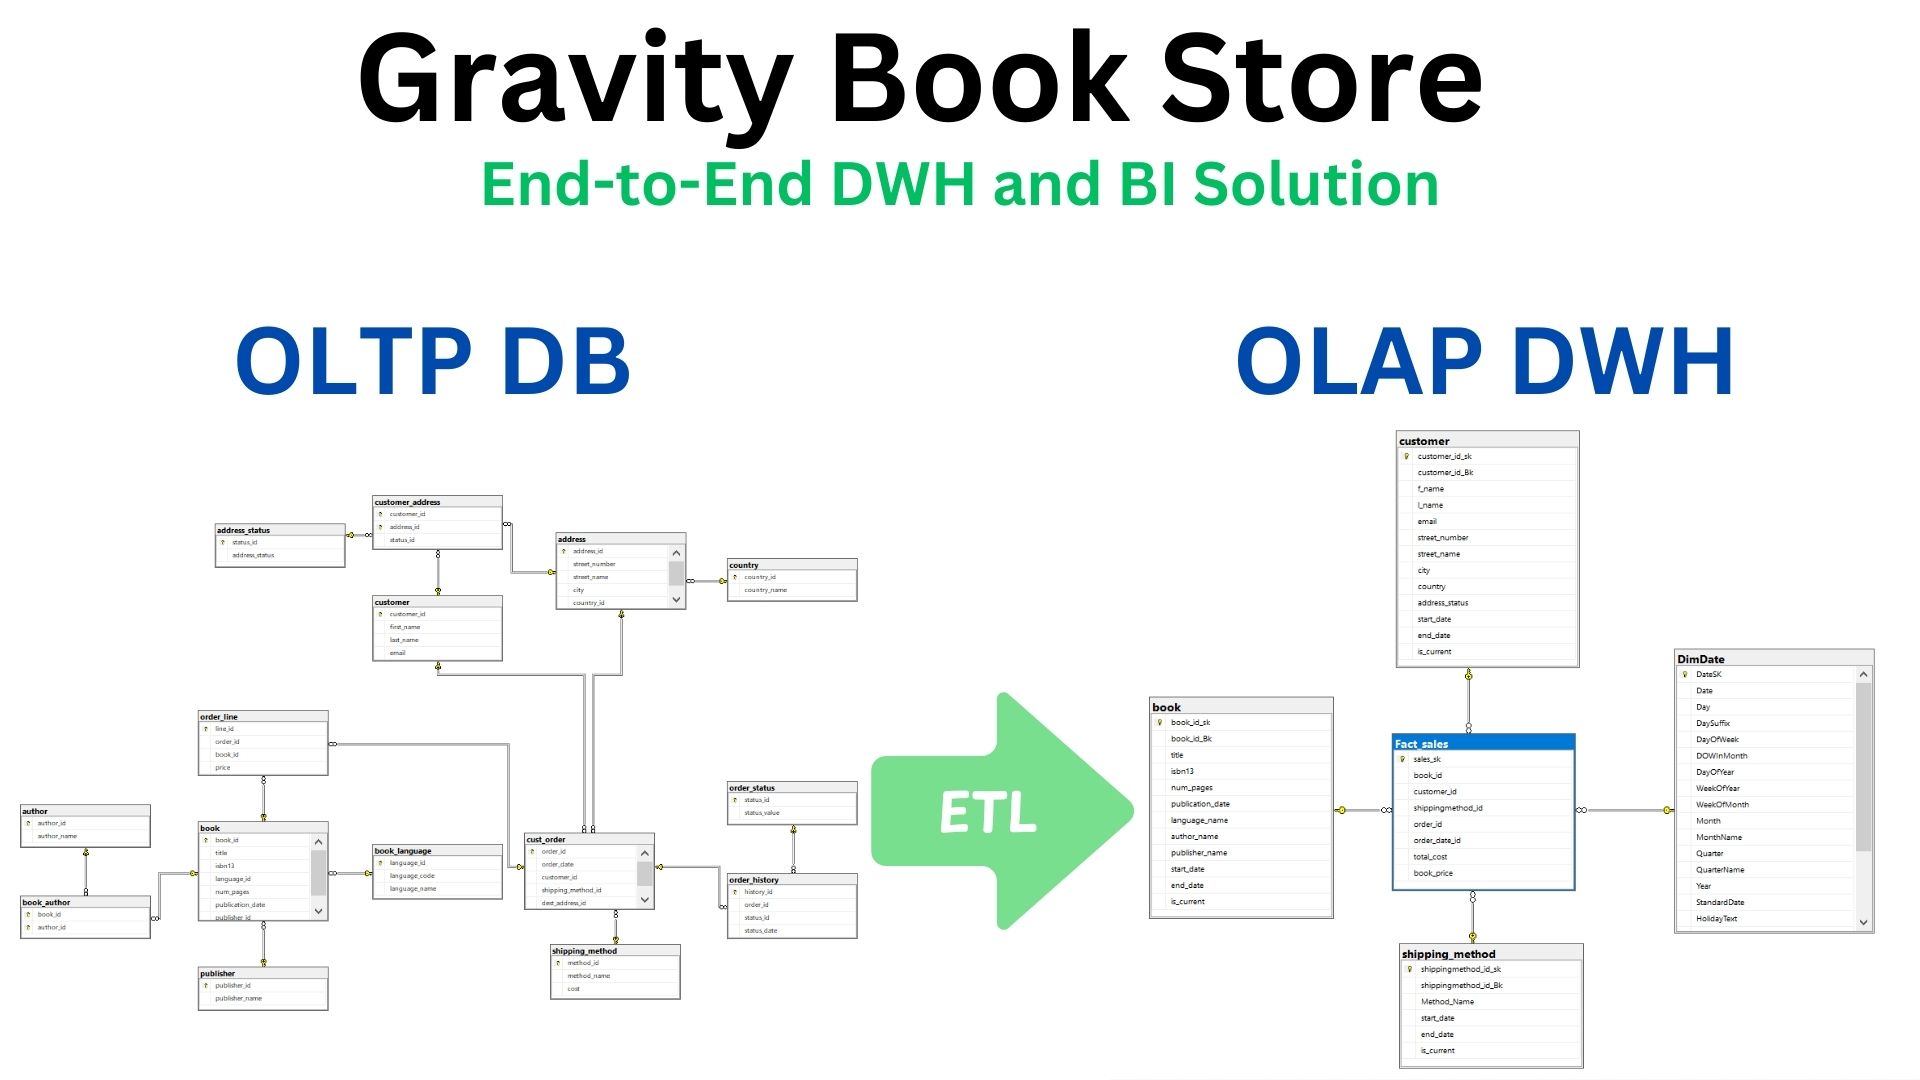
The project demonstrates the process of transforming an OLTP Database into an OLAP system (DataWarehouse).
It's an end-to-end data solution designed to transform raw transactional data
from a fictional bookstore into actionable business insights. The project encompasses data modeling, ETL processes,
data warehousing, OLAP cube development, and BI reporting, making it a comprehensive data engineering and business intelligence implementation.
 Dec 11, 2024
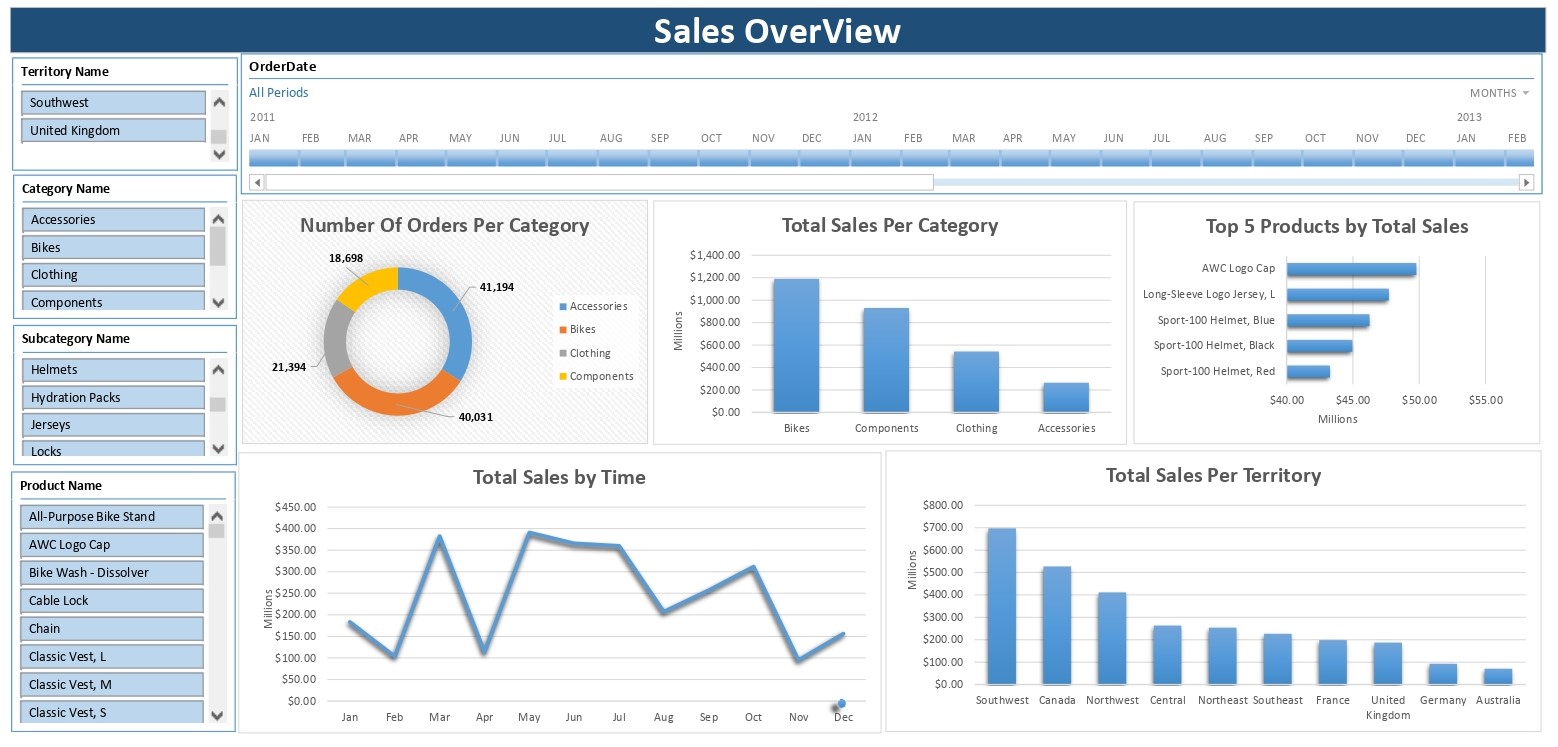
Microsoft Excel | Power Query | Pivot Tables
This project aims to provide a comprehensive analysis of the sales performance
using AdventureWorks dataset from Microsoft Learn.
I utilized Microsoft Excel, Pivot tables, and Power Query to perform an in-depth sales analysis.
The goal was to analyze raw sales data, identify key performance metrics,
and deliver actionable insights through a dynamic and interactive dashboard.
 Nov 21, 2024
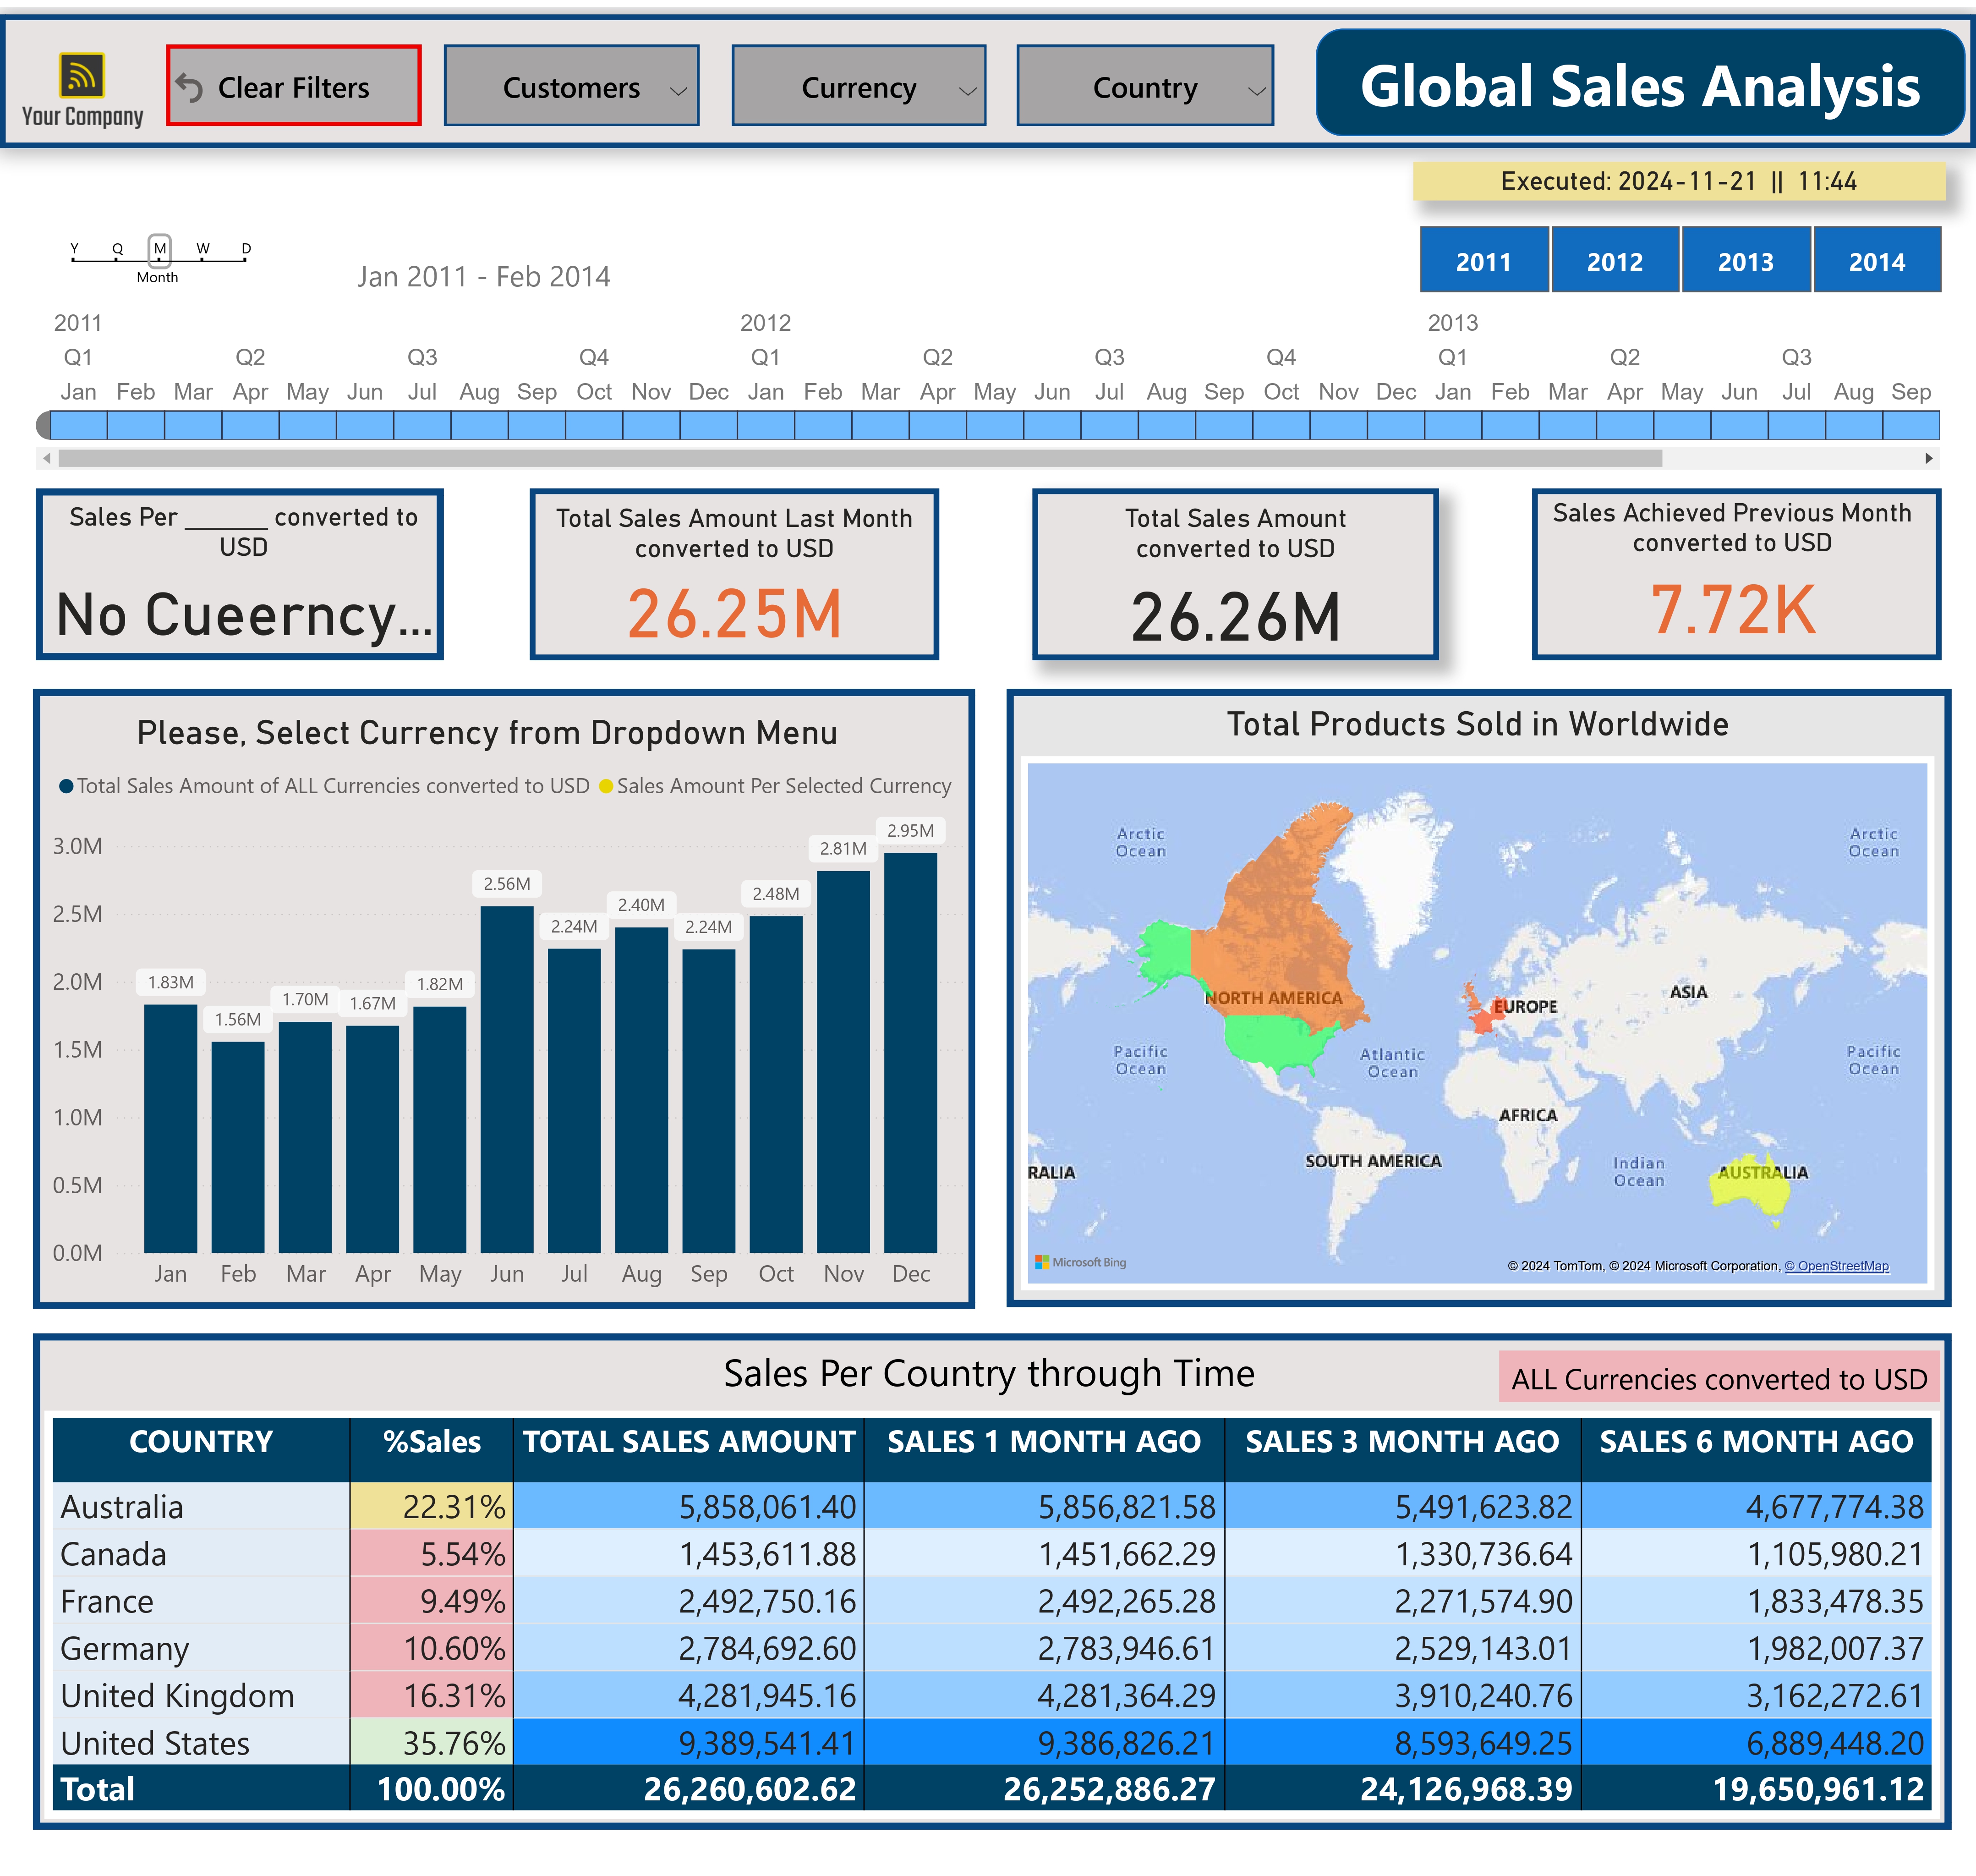
Power BI | Power Query | DAX
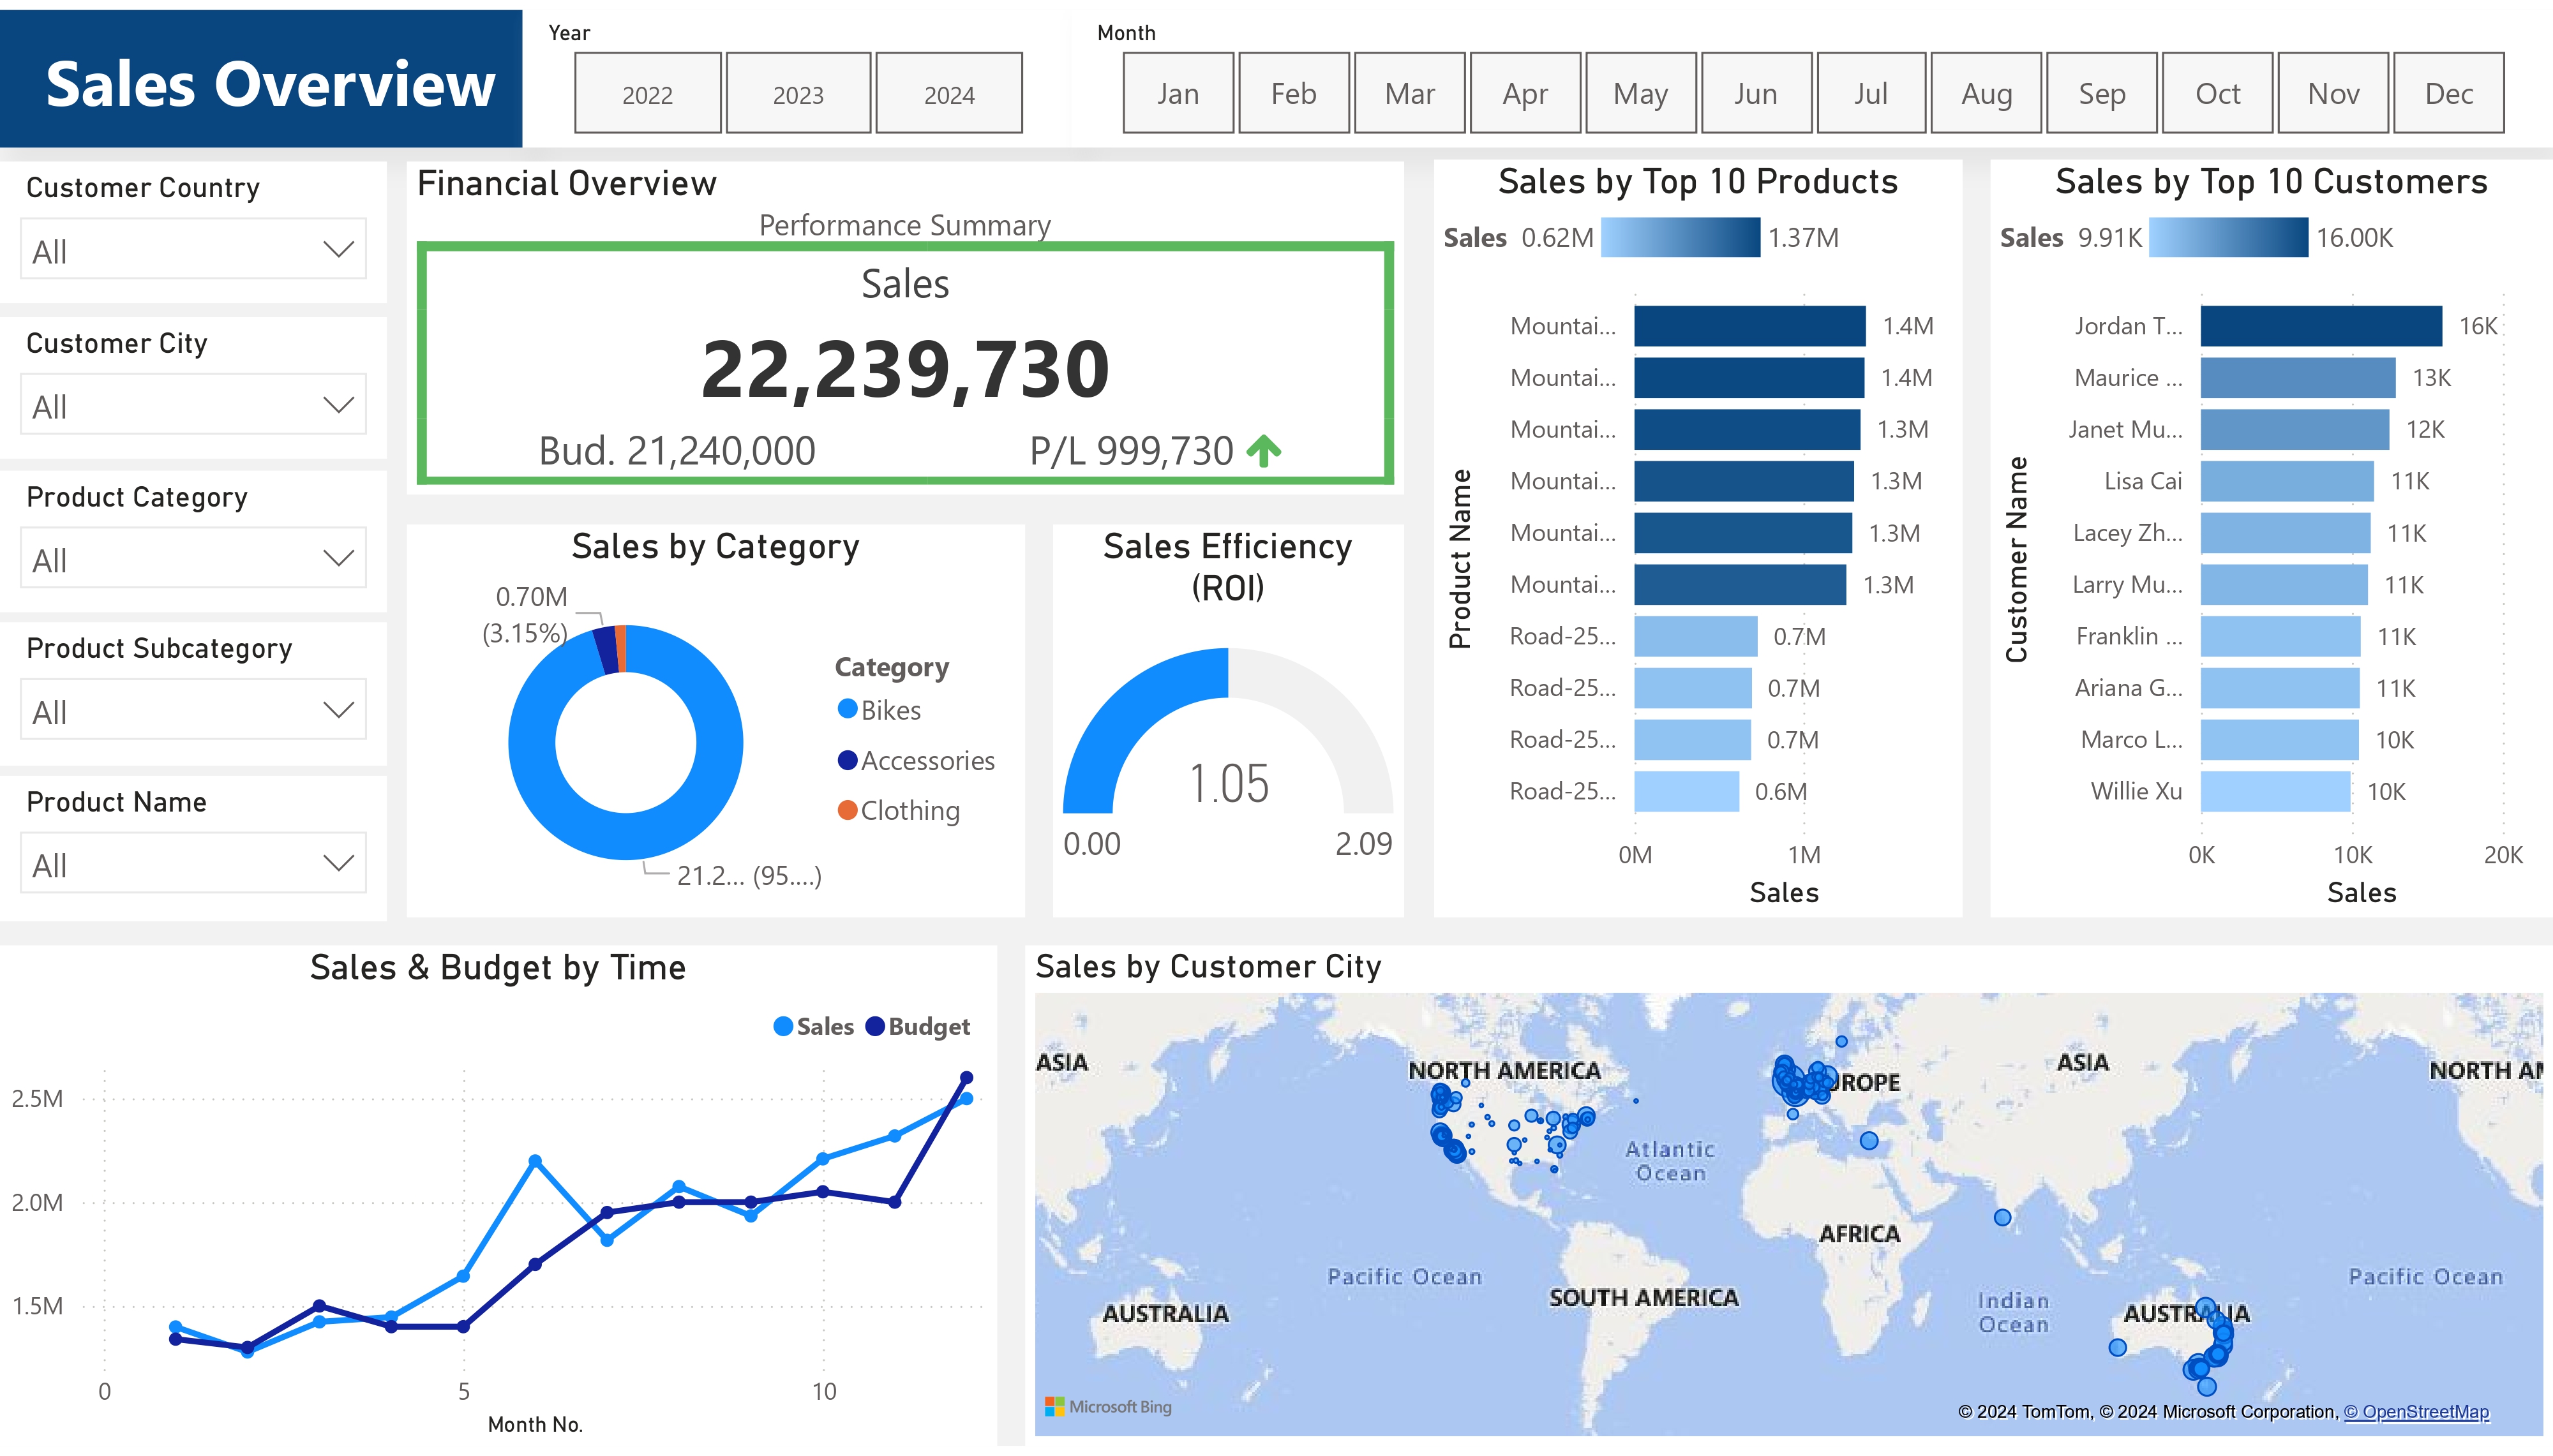
This project aims to provide a comprehensive analysis of the sales performance of
an international company operating across multiple regions and markets.
Key deliverables will include interactive dashboards, in-depth visualizations,
and detailed reports that highlight opportunities for enhancing sales performance
and addressing challenges in various international markets.
 Oct 17, 2024
SQL | Power BI | Excel
Data analysis project using the AdventureWorks sample dataset from Microsoft Learn.
Includes exploratory data analysis, SQL queries, and Power BI visualizations to gain
insights into sales, customers, and product performance.
The business problem typically addressed involves identifying areas for improving performance,
such as increasing sales, optimizing inventory, enhancing customer satisfaction,
or improving operational efficiency.